Correlating Different Immunoassay Concentrations
 |
| There are a variety of immunoassays that can help determine the concentration of a particular target. The basic principle relies on the use of antibodies to bind their intended analyte. This interaction is then quantified through the use of a reporting signal. |
| Enzyme-linked Immunosorbent assays (ELISA) tend to be the most popular immunoassay. This setup can include, but is not limited to, the use of a single antibody, often referred to as a direct ELISA, or an antibody pair that includes both a capture and detection antibody. The use of an antibody pair is referred to as a sandwich ELISA and this method is utilized by most of the ELISA kits we offer. There are also several different labels that can be conjugated to the detection antibody to provide the reporting signal. The most popular technique uses streptavidin and HRP, which use chemiluminescence as the reporter signal. However, other assays such as our LEGENDplex™ kit rely on the excitation of a specific fluorophore as the reporting signal. |
 |
| Given the variety of assays that can be developed, our team commonly addresses why two separate immunoassays may arrive at different conclusions for concentrations on the same sample. This type of discrepancy isn't uncommon for the following reasons: |
| 1) Differing Antibody Pairs It is likely the antibody pairs in different kits will use distinct clones, meaning the epitope and binding kinetics of the antibodies will be different in each assay. This can have a significant impact on the reporting signal. 2) Differing standards Vendor A and vendor B may have produced standards using different expression systems. In addition, not all recombinants are quality tested for immunoassays. Unless the vendor explicitly states the recombinants are tested with the immunoassay's detection and capture antibody, you should avoid using them in the immunoassay. This is one major reason we do not recommend using incompatible recombinants as standards in pre-established kits. 3) The Complexity of the Experimental Samples Differing sample types can vary in complexity. In general, serum/plasma contains other components that could influence how the antibody pair binds. It is also possible for the sample to contain endogenous binding partners, which can also affect the overall concentration. |
| Even though two assays may determine differencing concentrations for the same sample, the comparison between these two assays is an easy process, provided the concentrations fall within the linear range of the standards. |
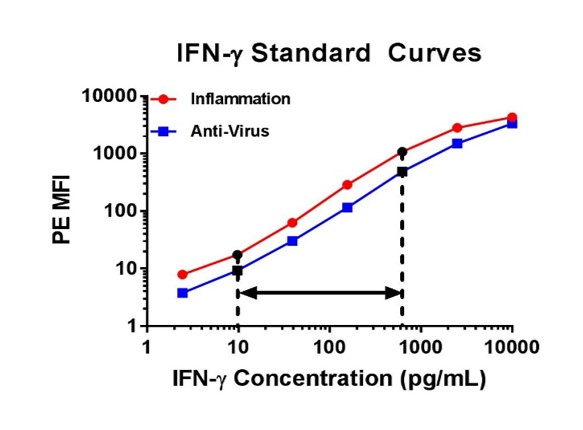
| For example, below on the left there are two standard curves for IFN-γ. Although both of these curves seem similar, we would only recommend you correlate the concentrations that fall into the 9.77 to 625 pg/ml range for IFN-γ, as the other portions of the curve are not linear. When performing a multiplex assay, the linear portion of the standard curve will need to be determined individually for each analyte. As an additional example, I have also included IFN-β curves generated from the same assay (below on the right), but with this data set it would be best to only correlate the concentrations that fall between 39.06 and 625 pg/ml for IFN-β. |
 |
 |
| This process only works when you are deriving concentrations from the linear portion of the standard curves. If the data does not fit well with a linear regression model, a more sophisticated curve-fitting model may be necessary. |
| Once you have determined which values are acceptable to run through a linear regression, you simply plot the concentrations obtained by each assay against each other and generate a linear regression line. As an example, I have included the concentrations (pg/ml) for IFN-γ detected with our Mouse Inflammation panel and Mouse Anti-Virus panel. These concentrations were determined through quantifying the same experimental samples using both assays. A linear regression line was generated that fits the concentrations that fall between 9.77 pg/ml and 625 pg/ml. |
 |
| From this linear equation, you can then plug in the values from one assay to determine what the equivalent corresponding concentrations are from the other assay using simple algebra. This works best when both assays you are comparing have broad linear ranges. It is also important to obtain a high coefficient of determination (R2) value to ensure the concentrations fit the linear regression line adequately. |
| Given the diversity of immunoassays, it is important to understand the concentration that is being determined is ultimately correlated to the standards used in that particular kit. Since each vendor has their own unique mechanism for producing and detecting those standards, it should not be a surprise that different kits determine two distinct concentrations. The use of a linear regression, as described above, can help you equate concentrations from one kit to another. |
| Contributed by Sean Cosgriff. |


Follow Us