 Login / Register


Loading...
Applications and Data

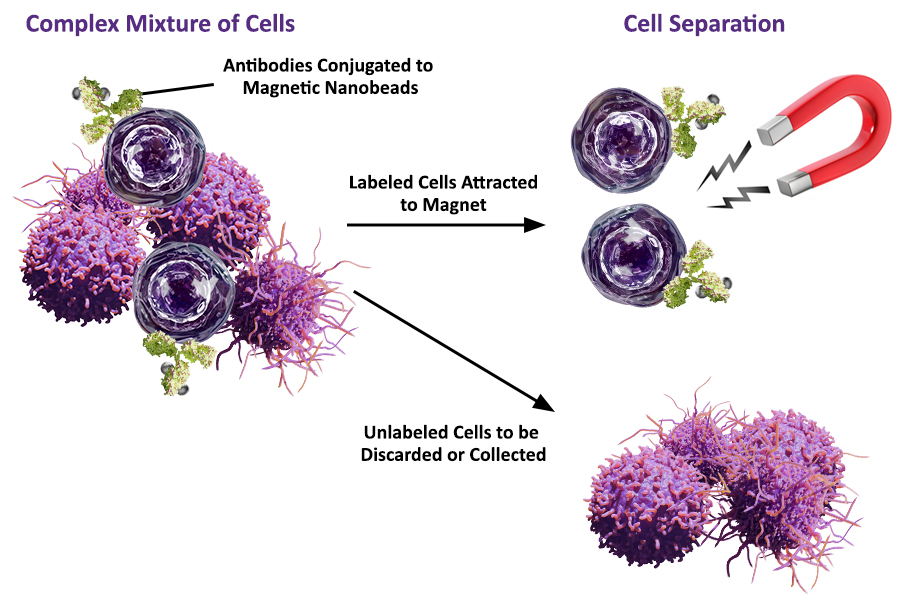
The isolation of a specific cell population from a complex sample has become a common lab procedure. The availability of highly specific antibodies and the demand for targeted applications keeps on pushing the limits of the cell separation field. Thus far, three major techniques have been used for cell separation: centrifugation-based methods, fluorescence-activated cell sorting (FACS), and magnetic cell sorting. FACS and magnetic cell sorting offer the advantage of a more specific isolation, as they use antibodies to select the target population. However, they differ fundamentally in the way they work. So how does magnetic cell separation work? Specific antibodies that are conjugated to magnetic particles will bind to the cells expressing the target antigen. Applying a magnetic field will attract the cells towards the magnet, separating them from the rest of the cells. Alternatively, a 2-step separation process can be done. For example biotin-antibody conjugates followed by streptavidin-conjugated beads, or a similar approach, can also be used.
Separation of cells can occur via “Positive Selection” or “Negative Selection” (also known as “Negative Depletion”). This depends on whether the bead-bound antibodies directly target your cells of interest (positive selection) or target unwanted cells (negative selection). Either way, both separated fractions of cells can be used for downstream applications.
MojoSort™ Particle Properties

Line graphs show the size distribution of BioLegend’s MojoSort™ Nanobeads, and the distribution of 4 other commercially available magnetic particles. BioLegend’s average size is 130 nm, with a narrow and consistent distribution to ensure consistent performance.

Line graphs show the size distribution of BioLegend’s MojoSort™ Microbeads. BioLegend Microbead average diameter is 1 µm, with a narrow and consistent distribution to ensure consistent performance.
MojoSort™ Dead Cell Removal Kit Data
Dead cells or debris can interfere with obtaining reliable readouts. Dead cells in particular can bind to antibodies non-specifically and, in the case of multiomics applications, take up precious reads in a library. MojoSort™ Dead Cell Removal Kits help researchers by removing dead cells from their samples for downstream analysis such as single-cell sequencing, cell line development, and flow cytometry – all without requiring calcium in cell separation buffers, resulting in high live cell enrichment and superior yield and cell recovery.
View the full data on our apoptosis webpage.

(Left) Live cell recovery comparison between MojoSort™ Mouse Dead Cell Removal Kit and Competitor A (Annexin-based). Dead cells were magnetically separated from heat-stressed C57BL/6 murine splenocytes (containing 40% dead cells) using recommended protocols for each kit. Percent live cell yield was calculated based on recovery of CD45+ Helix NP™ Blue– Apotracker™ Green– population relative to the unsorted population. Data represents compiled data from two technical replicates.
(Right) Three cell samples were collected and pooled on one CITE-Seq experiment: Fresh human PBMCs (healthy donor), 60% Viable PBMCs, and Post Dead Cell Removal Kit (contains the 60% Viable PBMCs pool cleaned up by MojoSort™ Human Dead Cell Removal Kit). Cells with higher Percent Mitochondrial Read in a library are commonly considered to have low cell viability.
In Vivo Data
CX3CR1+ Cells Migrate Back to the Bone Marrow After Adoptive Transfer

CX3CR1+ cells were isolated from C57BL/6 mice bone marrow using a two step separation protocol. Total bone marrow cells were incubated with directly conjugated Ly-6G Nanobeads to deplete granulocytes. After depletion, the resulting fraction was incubated with biotin anti-mouse CX3CR1 antibody followed by MojoSort™ Streptavidin Nanobeads, resulting in a population containing about 70% of CX3CR1-expressing cells. The cells were then labeled with CFSE and injected back into recipient C57BL/6 mice. Three days later, CFSE+ cells are found in the bone marrow of the recipient mice. Control mouse represents an animal injected with PBS.
Electron Microscopy with Separation Columns
Positively Selected Cells
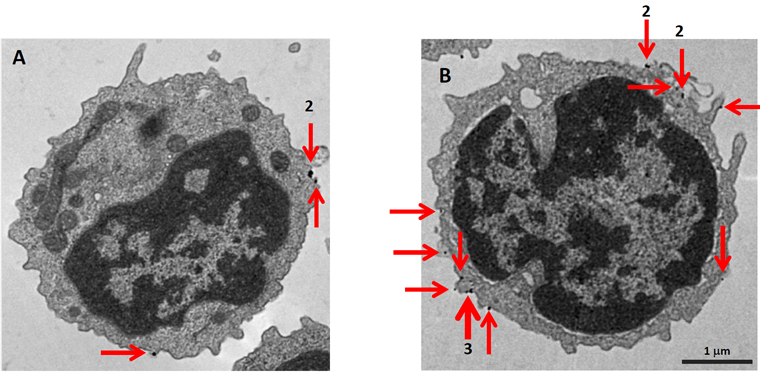
MojoSort™ Nanobead-isolated CD19+ cells using columns do not display more bound beads on the cell surface (A) as compared to cells isolated with a compatible commercial product using the same columns (B). Red arrows indicate where the particles are located. Numbers indicate either 2 or 3 magnetic particles adjacent to each other. Pictures were taken at the same magnification, scale shown in B. Images are representative of 41 different cells each.
Negatively Selected Cells
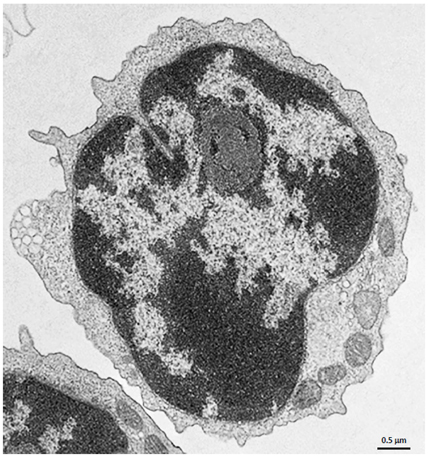
CD4+ T cells Isolated with MojoSort™ CD4 T Cell Isolation Kit using columns do not display particles in the cell surface. Image is representative of 36 different cells.
ProductsHere


Follow Us