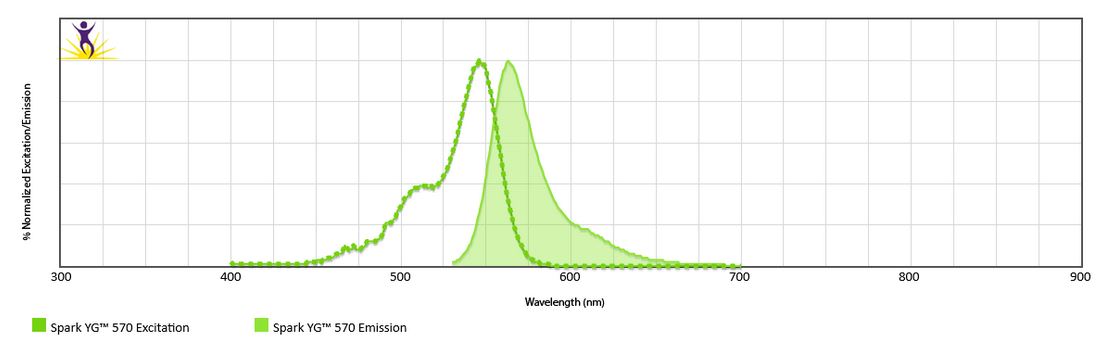
Normalized excitation and emission spectra of Spark YG™ 570 obtained from a spectrophotometer. To compare Spark YG™ 570 with other fluorophores, use our Fluorescence Spectra Analyzer tool.
Build Multicolor Microscopy Panels with Spark YG™ 570
Depending on the filter sets and light source of your microscope, Spark YG™ 570 can be used in combination with a variety of other fluorophores including DAPI, Alexa Fluor® 488, Alexa Fluor® 647, and Alexa Fluor® 750.
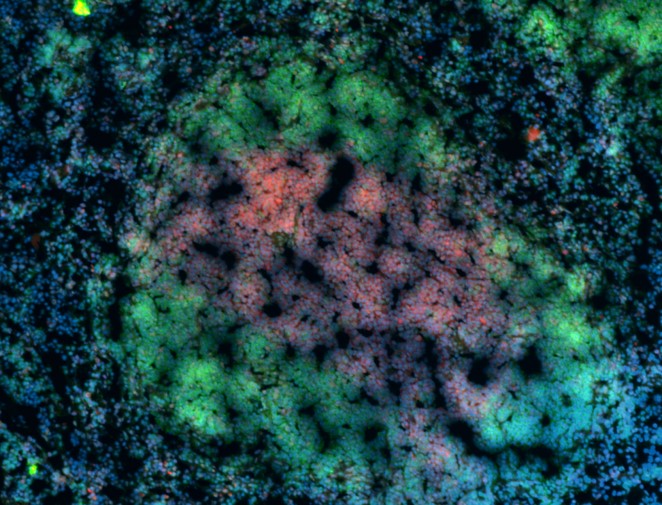
Immunohistochemistry on frozen mouse spleen tissue. Tissue on the left was stained with anti-CD3 Spark YG™ 570 (red), anti-B220 Alexa Fluor® 647 (green) and DAPI (blue). Tissue on the right was stained with anti-CD45 Spark YG™ 570 (red), anti-CD3 Alexa Fluor® 647 (green), and anti-B220 Alexa Fluor® 647 (blue).
Spark YG™ 570 Provides Similar Brightness to Alexa Fluor® 555
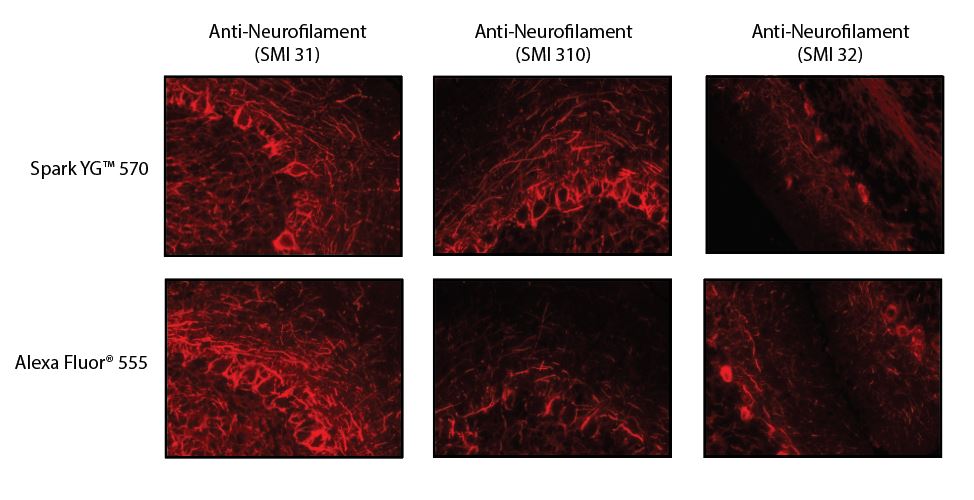
Rat (left and middle) or mouse (right) brain sections were stained with the indicated antibody conjugated to either Spark YG™ 570 or Alexa Fluor® 555. Across clones, tissues showed a similar brightness and staining pattern between the two antibodies.
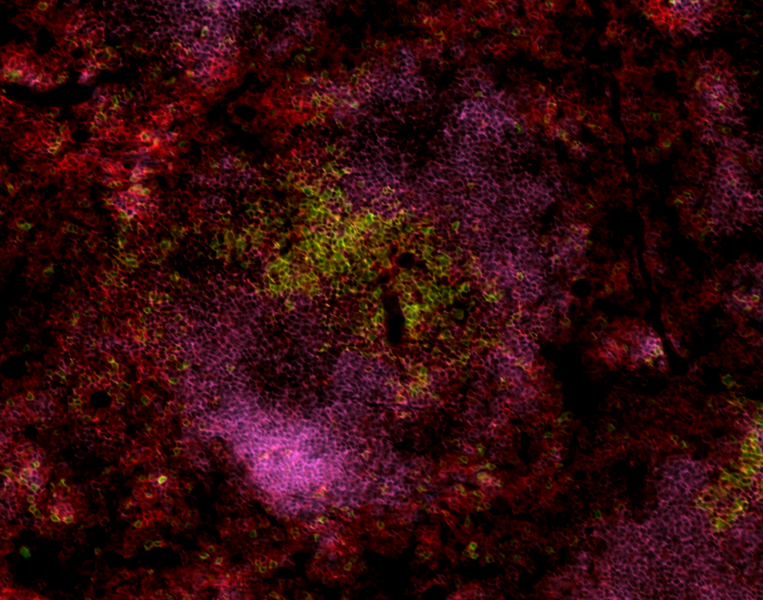
Spark YG™ 570 Demonstrates Minimal Bleed-through into Nearby Channels
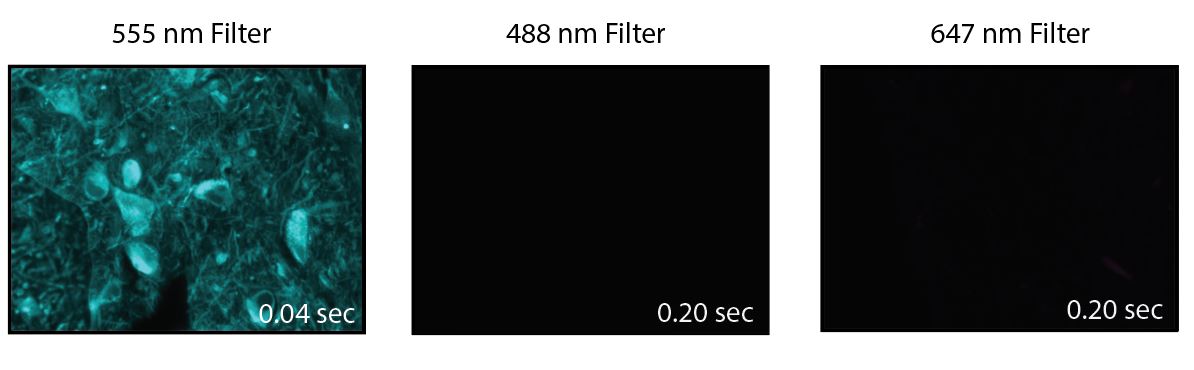
Human substantia nigra tissue was stained with anti-Tyrosine Hydrolase Spark YG™ 570 and imaged under a 40x objective. No bleed-through was observed in the 488 nm and 647 nm channels, even when using a five-fold longer exposure time.
Photostability of Spark YG™ 570
To test the photostability of Spark YG™ 570, we stained tissue sections with a purified antibody, followed by incubation with either an Alexa Fluor® 555 or Spark YG™ 570 conjugated secondary antibody. After staining, images were captured by exposing tissue sections to light at the specified time points.
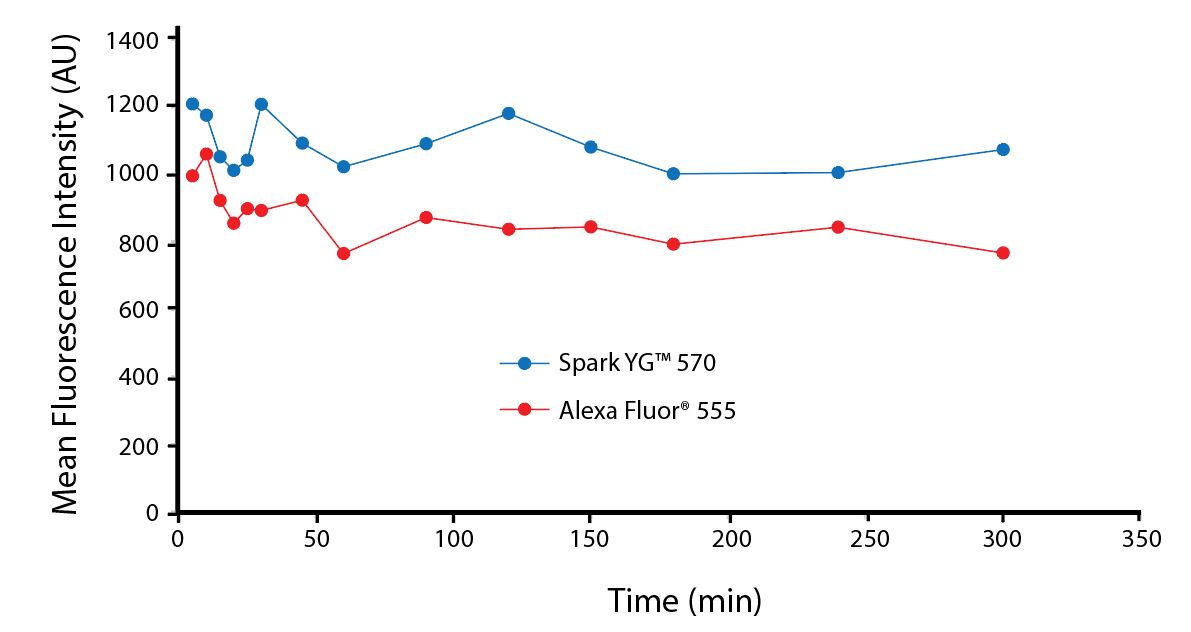
FFPE human tonsil tissues were stained with purified anti-CD8a (Clone C8/144B) followed by incubation with Alexa Fluor® 555 or Spark YG™ 570 goat-anti-mouse IgG (Poly4053). Images were captured at the indicated time points and mean fluorescence intensity, expressed as Arbitrary Units (AU) was measured using ImageJ.
 Login/Register


Follow Us