Page Contents
- Overview of the Analysis Pipeline
- Tools for Multiomics Analysis
- Analysis Guides
- Example Datasets
- Partner Datasets
Single-cell multiomics experiments generate a large amount of data. Choosing the optimal data analysis tool during each step of the data analysis process enables you to uncover unique biological insights from these data. Explore our resources to learn how to process and analyze data generated from experiments using TotalSeq™ antibodies.
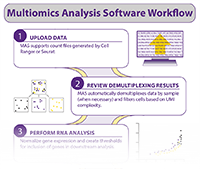
Multiomics Analysis Software (MAS) is our free cloud-based program that allows you to quickly and easily explore CITE-seq data without extensive bioinformatics knowledge.
Overview of the Analysis Pipeline
Sequencing
Primary Data Processing
Read more
Primary data processing (BCL to matrix file)
The single-cell libraries (GEX/ADT/HTO/VDJ) are sequenced on Illumina instruments, which generate raw base call files (BCL) as primary output. The per-cycle BCL files need to be translated to a per-read FASTQ file before proceeding with most analysis pipelines. The two most common conversion methods include Cell Ranger mkfastq and bcl2fastq.
Sequencing library multiplexing and multi-flow cell sequencing
In addition, multiplexed libraries (more than one library sequenced in a single flow cell) or libraries sequenced across multiple flow cells, can be demultiplexed during the FASTQ translation to yield the appropriate FASTQ files with the respective sample libraries. Note that combining or demultiplexing the samples within the libraries using TotalSeq™ hashtags happens during the subsequent multi/count pipeline steps (see below).
Quantification
Read more
FASTQ to count matrices and web summary
The FASTQ files are then typically run through the Cell Ranger count pipeline or similar, in which the reads are aligned and filtered, and the barcode and UMI sequences are counted. This pipeline produces a variety of file types such as BAM, matrix files, and summary files. If there are multiple samples within the libraries that have been multiplexed using TotalSeq™ hashtags, after FASTQ conversion the samples can be run through the Cell Ranger count pipeline or multi pipeline*.
*Note: While 10x Genomics does not officially support HTO + VDJ data analysis, the 10x data analysis pipeline Cell Ranger does currently support HTO + VDJ data. If you are using Cell Ranger multi v6.0 or higher for cell assignment/hashtagging/cell demultiplexing, please update the feature_type in the feature reference CSV to "Multiplexing Capture" for hashtag antibodies. Please see the 10x Genomics support documentation for more information.
A BioLegend notebook is also another option for analyzing HTO + VDJ data.
The Cell Ranger pipeline produces a Web summary.html file that contains metrics and automated secondary analysis results that can be useful for assessing both library and sample quality.
Raw and filtered feature-barcode matrices – Unfiltered (raw) and filtered feature-barcode matrices are output in both the Market Exchange format (MEX) and Hierarchical Data Format (HDF5). The HDF5 format matrices are the most commonly used and are typically the primary input for sequential analysis pipelines such as MAS, R (Seurat), and Python software. The unfiltered matrix contains every barcode from the fixed list of known barcode sequences that have at least one associated read. This includes background and cell-associated barcodes. The filtered matrix only contains cell-associated barcode sequences and is the primary input to the MAS analysis pipeline.
For more information on the file types that are not discussed here, visit the 10x Cell Ranger output review.
Downstream Analyses
Read more
Secondary Analysis
Dimensionality Reduction
Typical CITE-seq data sets are highly dimensional and contain information for thousands of genes, ADT and/or HTO reads, which are denoted as columns/features. They can also contain anywhere between 1,000 to 50,000+ cells (rows/observations), depending on the experimental design. Dimensionality reduction techniques help reduce the data complexity and aid in the visualization of this high-dimensional data. The most common dimensionality reduction methods used in CITE-seq include t-SNE or UMAP methods, both of which are non-linear methods that project data in the high-dimensional space into two (or more) dimensional space to enable visualization. Broadly speaking, these methods attempt to preserve local neighborhoods observed in the high-dimensions when projecting into the lower dimensions; i.e. cells that are close to each other in the high-dimensional space are typically close to each other in the lower dimensional space. As a result, clusters of cells are easier to visualize and probe them for co-expression patterns.
Normalization and identifying RNA with sufficient variance
Data normalization is a crucial part to the analysis of CITE-seq datasets data set since it helps reduce sequencing noise and bias that is present due to the inherent nature of this assay (i.e. gene length, GC content, sequencing depth, etc.). There are many methods available but most focus on correcting for the difference in RNA abundance related to the size of the cells. Once normalized the read counts more accurately reflect the differences in biology of the samples/cells rather than cell volume.
Clustering
Clustering of cells aids in understanding the cellular heterogeneity within datasets. Clustering involves the grouping of cells based on their “similarities”, found within the gene expression and/or ADT expression profiles of those cells.
 Login/Register


Follow Us