Introduction to Flow Cytometry
Flow cytometry, which first began to develop in the 1950s, is a technology for characterizing the phenotype and functionality of individual cells within a heterogeneous population. Using flow cytometry, researchers can measure cell size and granularity as well as investigate factors including viability, cell cycle, and protein expression.
During a typical flow cytometry experiment, samples are stained using fluorophore-labeled antibodies that recognize and bind specific cell surface or intracellular markers, or a variety of fluorescent chemical probes. Alternatively, the cells themselves may be engineered to tie the expression of a protein of interest to a reporter such as Green Fluorescent Protein (GFP).
Critically, as flow cytometry has advanced, the number of fluorescent readouts that can be measured simultaneously has increased, along with the sample processing speed. Researchers are continuously more engaged in high-parameter flow cytometry assays, analyzing twenty or more markers at high throughput, for deeper insights into the immune network of the host organism.
Whatever the aim of a flow cytometry experiment, and regardless of which flow cytometry platform is used, achieving accurate results hinges on experimental design. This means it is imperative to understand the expression level of the target, the capabilities of the cytometer, and the properties of fluorophores used for detection, especially when multiple fluorophores will be combined in a panel.
Principles of Fluorescence
Fluorophores used for scientific research include fluorescent proteins such as allophycocyanin (APC), phycoerythrin (PE), and peridinin chlorophyll protein (PerCP), as well as a broad range of synthetic fluorescent dyes, such as Spark Dyes. They are defined by their ability to absorb light within a known set of wavelengths (the excitation spectrum) before emitting it at another, longer range of wavelengths (the emission spectrum), which gives each fluorophore a distinct excitation and emission profile, as shown in Figure 1.

Figure 1. Excitation and emission spectra of Spark Blue™ 550.
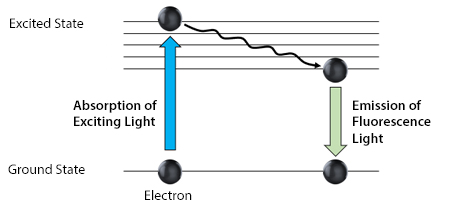
During the process of excitation and emission, the fluorophore’s electrons absorb energy from photons of light, which must subsequently be released for the electrons to return to their ground state. While some of the energy is released in the form of heat, the remainder is emitted as light photons. Since the light photons have less energy than the original photons, they have a longer wavelength and are consequently a different color. This is summarized in Figure 2.

Figure 2. Jablonski diagram showing the changing energy state of a fluorophore’s electrons.
The difference between a fluorophore’s excitation and emission maxima is known as the Stokes shift, as shown in Figure 1. Fluorophores with longer Stokes shifts generally exhibit lower background fluorescence and can also provide increased flexibility for panel design, most often through the use of tandem dyes.
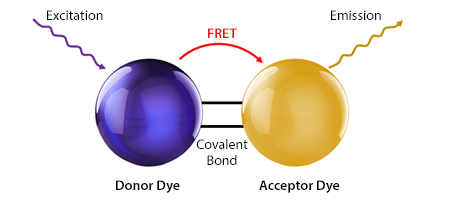
With large Stokes shifts that explored new areas of the spectrum, tandem dyes expanded panel options beyond the initial protein-based fluorophores the field started with. The concept of the tandem dye is based on two covalently linked fluorophores, a donor and an acceptor, of which the donor transfers energy to the acceptor following its excitation. This causes the acceptor to emit a fluorescent signal with a longer wavelength than the donor’s emission maximum, as shown in Figure 3. When tandem dyes are incorporated into a flow cytometry experiment, it is possible to generate multiple readouts from the same laser. For example, both PE and PE/Cyanine7 can be excited with a 488, 532, or 561 nm laser, but have emission maxima of 576 and 781 nm, respectively. Our Fire Dyes are tandem dyes, with PE/Fire™ 810 and APC/Fire™ 810 displaying peak emissions deep into the infrared region.

Figure 3. A tandem dye consists of a covalently linked donor and acceptor fluorophore.
In addition to the excitation and emission spectra and the Stokes shift, other important properties of fluorophores that should be considered during experimental design include the brightness, photostability, and fluorophore sensitivity to pH, temperature, and common buffer components.
Brightness
Fluorophore brightness is described by the molar extinction coefficient (ε), which is a measure of how much light is absorbed at a specific wavelength, and the quantum yield, which is the number of photons emitted relative to the number of photons absorbed. It is influenced by factors in a fluorophore antibody conjugation, including the fluorophore:protein (F:P) ratio, which varies depending on the size of the fluorophore and the method used for antibody labeling. In addition, the brightness can depend on the expression levels of the target antigen. In general, as the antigen expression level increases on a cell, more fluorescent antibodies will bind to it, increasing the observed fluorescence intensity. This is shown in Figure 4. Other variables affecting fluorophore brightness include the antibody affinity for the target and the instrument settings.

Figure 4. Higher antigen densities typically correlate with increased fluorescence intensity.
Flow Cytometry Applications
In contrast to bulk population analysis methods like western blotting and enzyme-linked immunosorbent assay (ELISA), techniques such as flow cytometry and microscopy can analyze individual cells. What sets flow cytometry apart is its high throughput capabilities, which gives it utility for research applications spanning cell cycle analysis and drug screening to an almost infinite number of phenotyping studies. In addition, clinical applications of flow cytometry include its use for diagnosing and monitoring immune disorders, cancer, and infectious disease, as well as for tracking a patient’s response to treatment.
- Phenotyping
Phenotyping is the process of detecting and quantifying different cell types within a heterogeneous sample. Using flow cytometry, it is possible to identify major cell populations based on light scatter alone, which is greater for larger, more granular cell types (e.g., granulocytes) compared to smaller, less granular cells (e.g., lymphocytes). However, it is more common for light scatter measurements to be combined with fluorescent antibody detection for deeper characterization of the sample – a process referred to as immunophenotyping.
A typical immunophenotyping study can involve detecting anywhere from one to 40 or more markers, depending on the research question being asked. For example, if the aim of the study is to simply identify all types of B cell within a sample of whole blood, these can be detected by staining for an antigen that is broadly expressed across the population, such as CD19. Similarly, CD3 is often used as a generic T cell marker. To identify specific cell lineage subsets, or determine the activation state of a particular cell type following exposure to different stimuli, the number of markers required can rapidly rise to over 20. In general, detecting 10-15 markers is the norm.
- Fluorescence-Activated Cell Sorting (FACS)
Fluorescence-activated cell sorting is similar to flow cytometry in that it uses light scatter and immunostaining to detect different cell types within a mixed population. Yet, during FACS, the cells of interest are retained for further study rather than being discarded. Traditional FACS instruments function by encapsulating each cell in a liquid droplet after immunostaining, to which an electric charge is then applied based on the detected signals. This enables the cells to be deflected into tubes or micro-titer plates for collection.
Microfluidic cell sorters have been developed as gentler alternatives to conventional FACS instruments. These offer the advantages of reduced sample input, elimination of the need for excessive sheath fluid, and greater ease-of-use. Many modern instruments also have a small footprint, allowing for their placement inside a standard biosafety cabinet.
Types of Flow Cytometry
While conventional flow cytometers are designed to measure a distinct range of emission wavelengths for each fluorophore, the technology has evolved. It is now possible to record the entire emission spectrum of a fluorophore for increased flexibility in panel design and to analyze and image extremely high numbers of single cells.
- Conventional Flow Cytometry
During conventional flow cytometry, the light emitted by each fluorophore is guided by a series of mirrors and filters towards the instrument’s detectors, each of which measures a distinct range of wavelengths. This means that the emission maximum of each fluorophore must be carefully matched to the available detectors, and that compensation controls should be included for removing fluorescence spillover. A main limitation of conventional flow cytometry is that it precludes the simultaneous use of fluorophores that are excited by the same laser and have similar emission maxima. Although this can be addressed during panel design, it can especially be problematic when only a small selection of labeled antibody reagents is available for use. However, with advancements in technology, expanding reagent offerings, and more sensitive detectors and filters, most advanced conventional cytometers can now examine 40+ colors.
- Spectral Flow Cytometry
Rather than measuring a distinct range of wavelengths for each fluorophore, spectral flow cytometry uses various technical approaches to full spectrum detection. While some instruments feature detection systems similar to those found in conventional flow cytometers, others incorporate gratings or prisms (instead of mirrors and filters) for light separation. Importantly, the separated light passes through a specialized (collimating) lens, which directs it linearly across a detector array. By recording the complete emission spectrum of every fluorophore, spectral flow cytometry allows the use of fluorophores with similar emission maxima but different off-peak emissions to be combined in the same panel. The most advanced spectral flow cytometers can readily detect 50+ parameters simultaneously, using a process known as spectral unmixing to identify each fluorophore by its unique spectral signature.
- Imaging Flow Cytometry
Imaging flow cytometry not only measures marker expression but also provides an image of each cell. This means it can reveal morphological insights, such as where in the cell a particular protein is expressed, whether that expression is uniform or punctuate, and if protein localization changes over time or in response to a particular treatment. Importantly, imaging flow cytometry brings the power of statistics to microscopy, a technique which has historically had only limited throughput. Applications of imaging flow cytometry include monitoring nuclear localization of DNA transcription factors, tracking the uptake of extracellular vesicles, and measuring the apoptotic index following drug treatment.
 Login / Register


Follow Us